
It feels like just yesterday I was getting ready for second-quarter earnings “watch parties,” and now we’re almost done with what has been a volatile reporting season.
What’s so great about earnings reports?
Pretty much everything, especially to a data-driven investor like me.
Earnings reports are critical to evaluating the strength of the company – and they are critical to my system’s fundamental rating and analysis of 6,000 stocks.
We also find out more about where the all-important Big Money is going – the money that really moves stocks.
Big Money flows are becoming more algorithm-driven, which I track with my Quantum Edge system. But when a new quarter starts, mutual funds and other investment vehicles also have up to 60 days to file their holdings with the Securities and Exchange Commission (SEC). That’s when you see all the headlines telling you what Warren Buffett bought and sold in his Berkshire Hathaway portfolio.
Wouldn’t it be a huge advantage to have this information more than quarterly? Like daily?
It’s possible. One of the biggest benefits of my quantitative analysis system is its ability to track Big Money flows in virtually real time. I may not know who specifically is buying what, but after every single trading day I can see which stocks were bought by the big boys that manage billions of dollars and their ubiquitous algorithms.
So I joined the party. Every morning, my master algorithms perform a comprehensive analysis of the roughly 6,000 publicly traded stocks on Nasdaq and the New York Stock Exchange. They bring in 120 independent data pulls on each and every stock, then apply 80 equations on them to analyze multiple factors – price, volume, earnings, etc.
Every company is scored on 29 primary ratings, including 17 technicals, which tell us how shares are trading in the market, and 12 fundamentals, measuring how healthy the company is.
All told, that’s nearly a million data points per day – and what a rich story it tells.
Each stock is assigned a summary report like this one for Nvidia (NVDA), one of the, if not the most, talked-about stocks of the year.
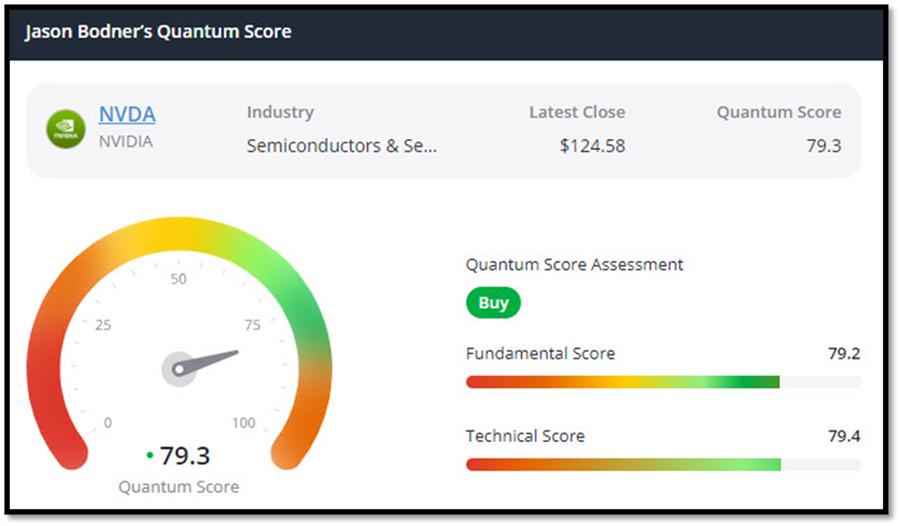
Source: TradeSmith Finance
That Quantum Score gets me most of the way there in determining whether a stock is likely to move higher or not:
- Under 70 is typically not a buy, as the stock doesn’t have enough strength or momentum to get very far.
- Between 70 and 85 is right where I like to see it – and a big potential payday opportunity.
- Over 85 gets trickier because the stock could be overheated and face a pullback.
My master algorithm then sorts stocks from strongest to weakest, giving me a cumulative “report card” of thousands of stocks. The higher up on our report card, the more likely they are to buy.
One of the keys in all this is Big Money buying activity… finding out which stocks are being bought by billion-dollar investors, hedge funds, pension funds, and other institutions.
Check out all of those flashing green lights on the chart below. That’s Big Money gobbling up NVDA here in 2024.
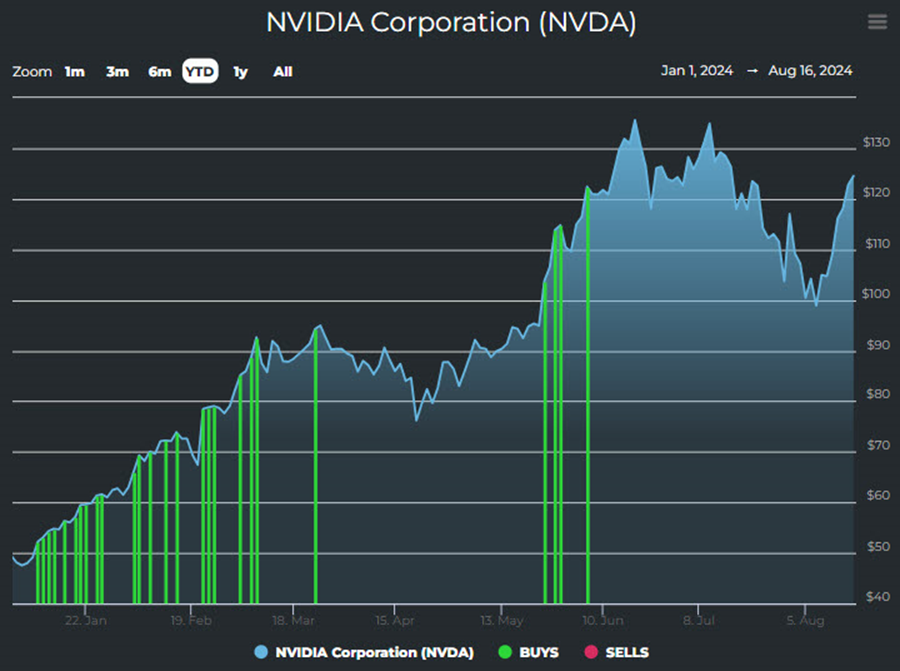
Source: MAPsignals.com
This gives us our best chance of hopping onto a stock surging on big institutional money flows. And having access to this information every day gives us a huge advantage of having to wait for SEC filings that may only come out four times a year.
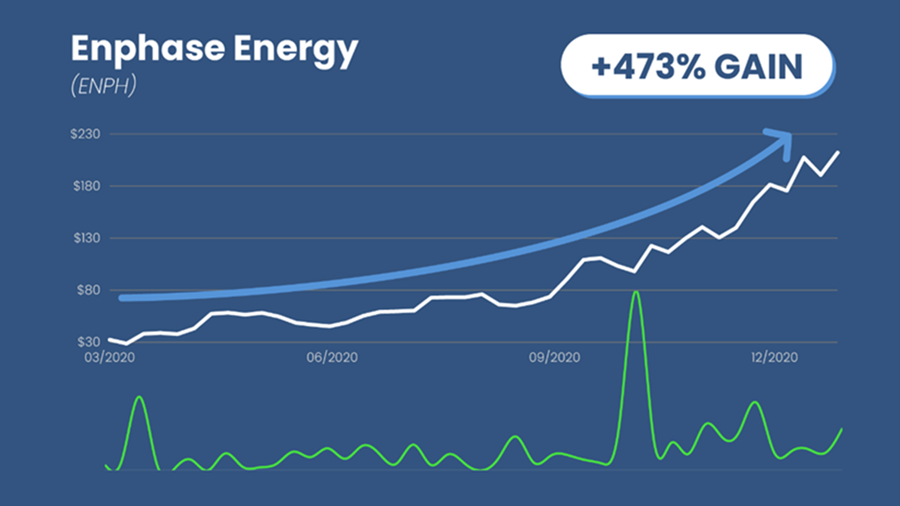
Here’s another good example of what I mean.
During the 2020 crash, the Master Algorithm crunched all 29 data factors and overlaid them with Big Money buying behavior, and we got a Quantum Score of 70.69 for a company I had never heard of: Enphase Energy (ENPH).
The key numbers were solid, and Big Money was jumping in. ENPH shot up 473% over the following months.
Spotting the Winners Amid the Noise
I started tracking those green lights – or Big Money – after spending years running trading desks and watching those trades – millions and even billions of dollars – passing through my hands.
According to independent studies by JPMorgan and Morgan Stanley, institutions already control some 90% of trading on Wall Street. And most of that now passes through algorithms.
I learned the tricks of the trade to keep those massive money flows as quiet as possible, so Big Money won’t tip its hands. Knowing those tricks, I designed algorithms that act like x-rays – seeing below the surface to detect Big Money at work.
This data has always been critical to picking winning stocks, but in today’s age of distrust, tracking the moves of big investors has never been more important.
As the old saying goes, “Actions speak louder than words.”
I didn’t anticipate this when I developed it, but the master algorithm couldn’t be available at a more opportune time. By tracking the money flows Big Money tries to hide, we analyze the actions the major players are taking, which are ultimately much more influential than the words being spoken.
By all means, focus on upcoming earnings reports to analyze the strength of any business you may be interested in owning a part of.
Check the stock’s technicals to get a sense for how it trades.
And remember the Big Money factor. Collecting big paydays is possible if, like my master algorithm, you know how to decipher when and where big money is getting positioned.
Talk soon,

Jason Bodner
Editor, Jason Bodner’s Power Trends
Disclosure: On the date of publication, Jason Bodner held a position in Nvidia (NVDA) mentioned in this article.
