
When you and I buy stock – even if we’re buying what we would consider a lot – it’s nothing compared to Big Money.
These largest investors on the planet buy and sell millions of shares of stocks, even tens of millions.
When we buy, it’s like a few snowflakes falling gently on the ground. They add to the pile, but the impact is negligible.
But when Wall Street enters a trade, it can be an avalanche that changes the landscape.
Wall Street is constantly making massive billion-dollar trades that move stocks, whole markets, even entire economies.
You would think trades this massive would be easy to spot.
But here’s the crazy thing… they aren’t.
And why is that?
Because Big Money does its best to keep these trades quiet by spacing out their buys and sells and even “hiding” them on secret exchanges known as dark pools.
But, if you can spot them – as I learned to do – you can anticipate stock price movements with stunning accuracy.
And that’s a huge advantage over just about every other investor out there.
Case Study: Big Money In Action
My job running a trading desk and matching these institutional buyers gave me a unique vantage point to see just how Big Money investors operate – which is basically as secretly as they can.
If that feels like it puts you at a disadvantage… well, it does. According to two separate studies – by JPMorgan and Morgan Stanley – institutions now control about 90% of all stock-market trades.
What’s more, nearly 100% of the trades executed by institutions involve computer algorithms that can operate in fractions of seconds. And with the advent of AI, we’ve reached an inflection point as the biggest institutions are preparing to unleash AI on the stock markets.
If you don’t know where those billions of dollars are flowing, you’re immediately swimming against the tide.
But my front-row seat to the tricks of Big Money helped me level the playing field.
These buyers and sellers I played matchmaker for were the heavy hitters – the largest professional investors on the planet.
That job gave me a special window into an elite corner of Wall Street, a “club” whose members operate skillfully and stealthily – even as they heavily influence which stocks win and which ones lose.
I watched. I learned. And I asked a lot of questions.
I noticed that when huge investors made moves, tell-tale signals were given off – even if they were made on anonymous exchanges or through professionals like me whom they paid to act as quietly as possible.
These signals were like “footprints” that could be tracked. And those footprints let me see when unusual trading was occurring. These signals weren’t visible to the naked eye, but I designed algorithms to retrieve and analyze data (I’m a data freak) that show me when this unusual trading activity takes place.
You might think: Just look when a stock moved up or down on larger than usual volume. That’s part of it, but there’s a lot more to what’s going on – and it’s not always visible on a chart.
Just take a look at this stock chart of Meta Platforms (META), the social media giant formerly known as Facebook…
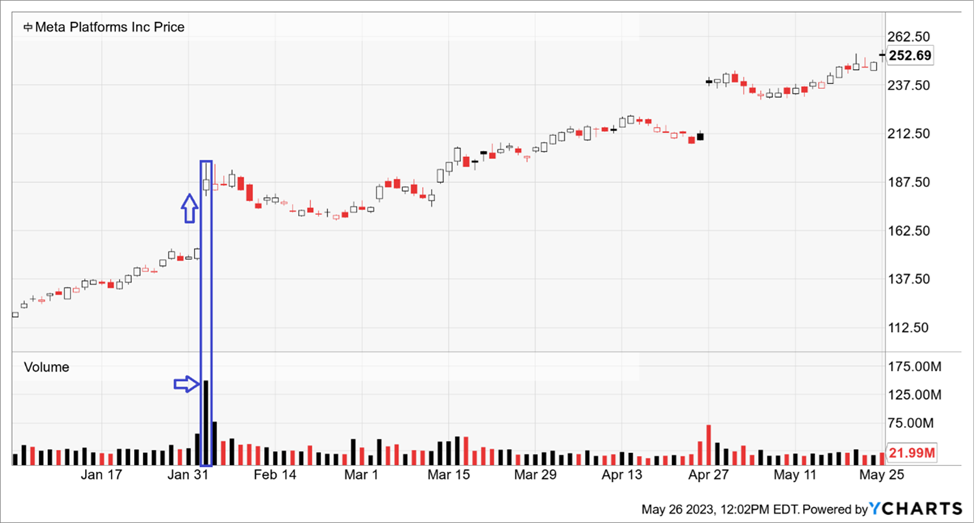
You see a huge gap up in price on a day when there was also huge volume (the bars at the bottom). Investors rushed in to lift META 23% on Feb. 2, 2023, the day after CEO Mark Zuckerberg declared 2023 the company’s “year of efficiency.”
And that was after the company reported a 55% drop in net income from the year before.
Nobody could have expected that, right?
Well… the “smart money” seems to frequently sniff out such things before everyday investors. That was true here. Remember when I told you that unusual trading activity wasn’t always visible on everyday charts?
Just look at this chart from inside my Quantum Edge system. It’s a visual representation of the results from my system’s algorithms. Notice anything?
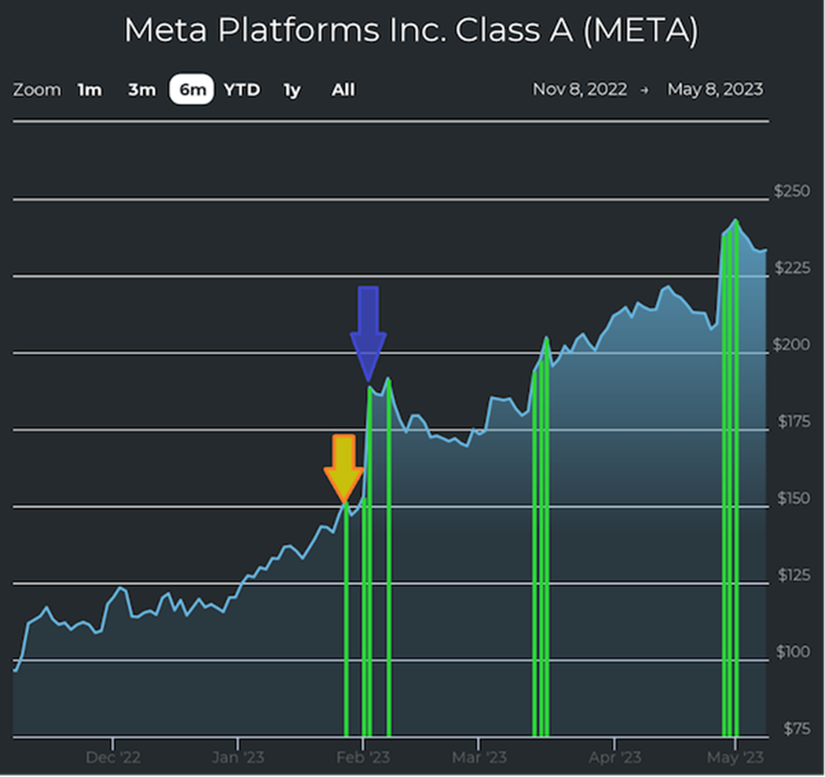
Source: MAPsignals.com
I highlighted that Feb. 2 price spike and huge volume with a blue arrow. That’s the same day that I highlighted on the price chart.
But now look at that yellow arrow. That points to Jan. 27, and that green bar – or “green light” as I often refer to them – is a signal my system picked up of unusual buying a full 5 days before a 23% surge.
I may not know the “why” behind a green light, but that doesn’t matter as much as the “what” – which is Big Money at work. Being able to see where money is flowing gives us a huge advantage.
How huge? The data shows our system picks stocks that make money roughly 70% of the time, and it outperforms the market 7-to-1 over three decades of data.
More than ever in this age of AI, investors need to ride the wave of Big Money, not fight it. I can’t overstate its importance, and we’ll talk more about it next week.
Talk soon,
Jason Bodner
Editor, Jason Bodner’s Power Trends
