
We’ve talked a lot recently about how Wall Street’s algorithms now dominate trading activity.
Every investor needs to be aware of this because it impacts virtually every stock that you own or might own.
And algorithmic domination is only intensifying as Big Money incorporates artificial intelligence into its technology. Believe me, these firms have the money to do it.
- The U.S. Patent Office reports that JPMorgan just applied for a trademark for its own AI called IndexGPT.
- Wells Fargo has teamed up with Stanford University to train more than 4,000 employees on using AI.
- Deutsche Bank recently partnered with Nvidia (NVDA) of all places to help their traders “to manage risk and run more scenarios faster and at scale.”
If AI is not powering algorithms already, it most certainly will.
Here’s the key: All of the biggest Wall Street algorithms work off some combination of the same core indicators.
Data scientists call it “Algorithm bias.”
Science X refers to it as algorithmic “herding.” Their researchers have labeled it a “major problem,” saying, “If everyone uses similar algorithms, then herding behavior emerges.”
As someone who worked inside the Wall Street machine, I’m very familiar with the herd mentality. And, in fact, the key to making good money is detecting those herding patterns as they’re forming. Once you know what those indicators are, you can build an algorithm to track the algorithms.
That’s what I did with my Quantum Edge system. I’ve mentioned how it analyzes fundamentals, technicals, and Big Money patterns for roughly 6,000 stocks. I can’t give away all the secrets, but I do want to offer you a simple way to get started on your own.
For our recent Project Greenlight event, I boiled my Quantum Edge algorithm down to six core Big Money indicators. Here they are…
1. Sales Vector: I especially focus on one- and three-year sales growth, and I look for rising trends. You can get these numbers from any decent financial website.
2. Earnings Vector: Pretty much the same as sales but looking at the bottom line. I analyze one- and three-year earnings growth and want to see a growing business.
3. Future Sales and Earnings Growth: You can calculate these looking at both company guidance and analysts’ estimates. They need to be positive, of course, and ideally also show a building trend. I know Wall Street is often wrong with its estimates, but the good news is that they usually undershoot.
4. Profit Paradigm: Businesses that make money have a much higher probability of making you money. I look for healthy profit margins that are growing over time. You can find these in quarterly earnings reports.
5. Price and Volume Vector: This analyzes how the stock is trading. Start with the 50-day moving average for the stock’s price, which you can find on charts and sometimes in quotes. Then compare that to the 100-day and 200-day moving averages.
You want them stacking from shortest to longest. In other words, the 50-day should be higher than the 100-day, and the 100-day should be higher than the 200-day.
That indicates upward momentum – another core indicator coded into institutional algorithms.
6. Unusual Buying Signals: You can’t get my proprietary Big Money buy signals on your own. I provide that to my institutional clients and my Quantum Edge Pro readers when I recommend a stock.
But you can at least take a step in that direction by looking for stocks with confirmed institutional support. I’d say look for companies where 70% or more of the stock is owned by institutions. That can be an indicator of future institutional buying.
You can find this information on most reputable sites, as well. For example, on Yahoo Finance it is under Statistics à Share Statistics. Here’s what it looks like for Tradeweb Markets (TW), one of our biggest gainers in Quantum Edge Pro.
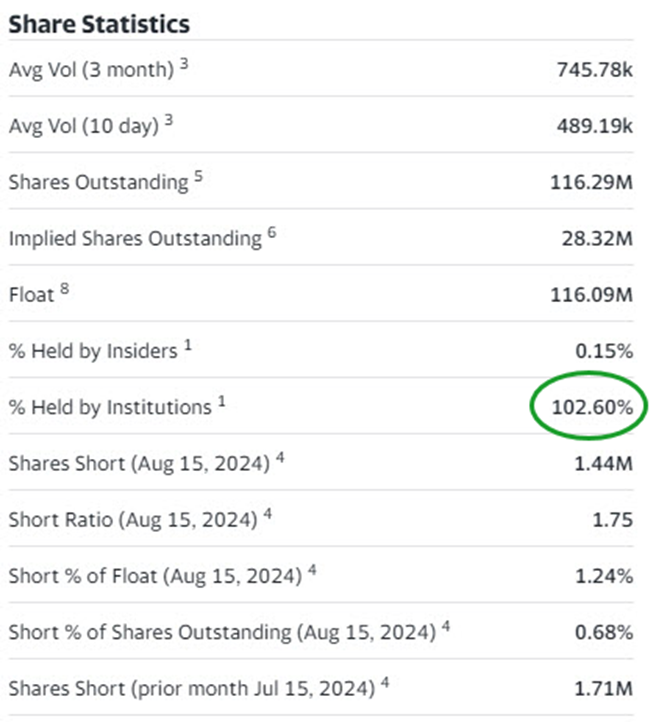
Source: Yahoo Finance
That shows 102.6% institutional ownership for TW, which is possible through things like margin. That’s a good indicator.
We get much more detail about Big Money’s activity in my Quantum Edge system. The algorithms run their high-powered analysis and generate a visual that helps us see it. Those are the green lights I love to see, and I count 15 of them in the last 12 months for TW, which has jumped 36% in that time.
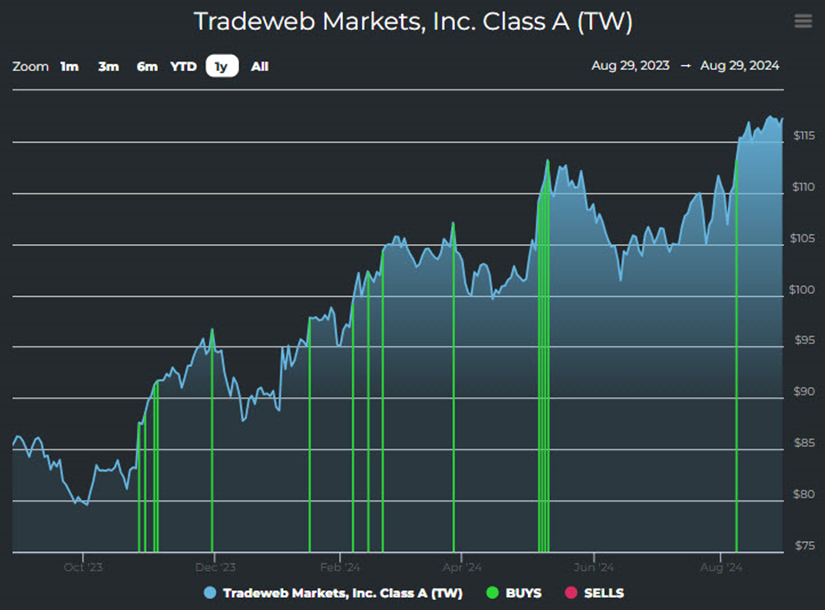
Source: MAPsignals.com
Pay attention to these six Big Money indicators, and I’m confident you’ll significantly improve your investment performance.
Not only will you find high-quality stocks, but these are the same indicators the big institutions are looking at, too. The same ones they’ve built into their core algorithms that dominate trading. The same ones that control massive amounts of money.
Talk soon,
Jason Bodner
Editor, Jason Bodner’s Power Trends
P.S. Everyone thinks stocks go up and down based on earnings, news, or events.
That’s a part of it, but what really matters is where the Big Money is flowing. This is the money that moves stocks.
My research shows that institutions move more than $400 billion through the stock markets every single day, and algorithms determine where the vast bulk of that money goes.
That’s why I designed my Quantum Edge system… to track these massive amounts of money right down to the ticker symbol.
The goal was to study how algorithms (including AI) are taking over Wall Street… and to show folks how to prepare and profit.
You can get more details in a special video briefing, in which I also tell you about an AI stock (including its ticker symbol) that is instrumental in powering the whole U.S. economy.
